
Code Green Solutions

It has been widely reported that 2012 was the hottest year on record in the continental United States. This year has not been much different with NOAA recently reporting that not only was June 2013 one of the hottest month’s of June ever, it represented the 340th straight month we’ve experienced warmer than average global temperatures. For those without a calculator, that is more than 28 years of warm weather. With this in mind, and also in light of the recent tragic heat related deaths in New York, we thought it was worth revisiting a fascinating paper published in Environmental Health Perspectives back in 2009 which attempted to map the community determinants of heat vulnerability and identify priority areas for intervention.
According to the IPCC, the occurrence, length, and severity of heat waves is rising, and is predicted to follow that upward trend as global climate change continues. This is bad news since, as the paper notes, heat waves are associated with increased heat-related mortality, cardiovascular mortality, heart attacks, respiratory mortality, and hospital admissions. But who is most vulnerable to these heat-related illnesses?
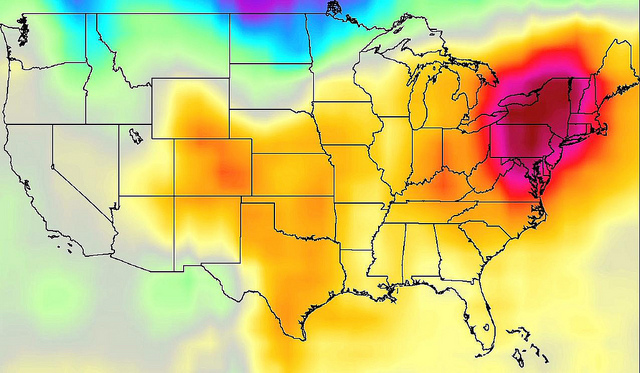
Mapping Community Determinants of Heat Vulnerability examined and mapped 10 variables tied to heat vulnerability, such as age, ethnicity, income, land cover, and prevalence of air conditioning. Doing so allowed researchers to identify geographic regions with relatively higher levels of heat related vulnerability. Results showed that areas in the Northeast and Pacific Coast, especially inner city urban areas, were the most vulnerable to heat.
The least vulnerable regions were those with high prevalence of air conditioning, but the authors warn against promoting air conditioning as a primary heat wave adaptation strategy since doing so would increase both fossil fuel use and the urban heat island effect (via exhaust waste heat). They instead point to “modifications to the built environment” including “tree and shrub planting, reflective paving surfaces, and natural ventilation.”
The bottom line is that heat vulnerability varies spatially, and so the negative impacts of increasing temperatures will be felt unevenly across the population. Tools such as the vulnerability index described in this paper (which has been further explored by the authors) can be used to help identify populations likely to feel the brunt of future heat waves, allowing public officials to prioritize action in communities where it is needed most.


