
Code Green Solutions


The U.S. EPA’s EJSCREEN: Environmental Justice Mapping and Screening Tool is an invaluable resource for understanding the environmental justice context of a proposed land-use or building project. It uses publicly available data that is linked to a dynamic Geographic Information Systems-based (GIS) map environment that runs entirely online. The system covers the entire U.S. at a very granular scale relative to Census boundaries. A user can view and make changes to the online map of their chosen location based on scale, boundaries around a site, and which Environmental and Demographic Indexes to view and overlay, and then automatically generate reports with the map images and tables.
How does it work?
According to the U.S. EPA website: “EJSCREEN allows users to access high-resolution environmental and demographic information for locations in the United States, and compare their selected locations to the rest of the state, EPA region, or the nation. The tool may help users identify areas with:
There are 11 Environmental Indexes and 6 Demographic Indexes that can be selected to create data tables and maps of a specific location based on the users chosen radius. Apart from making the demographic data and the environmental data collected by U.S. EPA and others more readily identifiable in specific locations, EJSCREEN then provides the opportunity to create Environmental Justice Indexes. Each of the 11 Environmental Indexes can be converted into an Environmental Justice Index by combining the Demographic Indexes specifically for 1) low-income and 2) minority populations. It is important to note the word “index.” Each Environmental and Demographic data point is converted into an index which relates it to State, EPA region and national level data. In this manner one is more directly seeing the place through its relationship to places and populations at the larger scale.
Environmental Justice Indexes
The Environmental Justice Indexes are the heart of the EJSCREEN Tool. As an example, one can map traffic proximity and volume, and also diesel particulate matter in the air, to generally understand these levels of air pollution at or near a project site. However this does not relate these factors to the presence of people or those who may have pre-existing susceptibility to these pollutants. This is the essence of social equity and environmental justice, i.e. that those who are most likely to suffer consequences from existing conditions or new actions are identified and targeted for solutions apart from the average population. The Environmental Justice Index for each of the 11 Environmental Indexes (including traffic and diesel particulates) factors in the presence of higher proportions of minority and low-income person who in turn are more “susceptible” populations to the effects of these pollutants. An environmental justice strategy related to these traffic-related pollutants might look to developing strategies to help alleviate these stresses at the project site and surroundings.
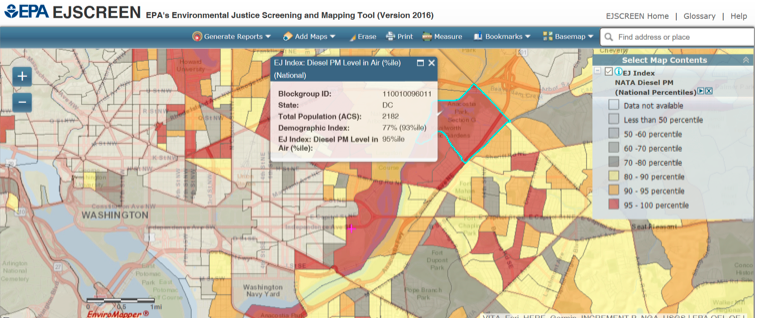
EJSCREEN reveals that this census block group (110010096011), located in Ward 7 of Washington, DC, contributes to the nationwide disparity in exposure to diesel particulate matter in the air. The EJ Index is higher in block groups with large numbers of mainly low-income and/or minority residents with a higher environmental indicator value. Image: U.S. Environmental Protection Agency
Social Equity Design Using EJSCREEN
The EJSCREEN also links to reports from the American Housing Survey and the Centers for Disease Control on additional measures – such as health factors – and the percentiles of at-risk populations to augment the 11 primary Environmental Indexes in the EJSCREEN itself. In addition, the U.S. EPA website for the EJSCREEN has guidance and video tutorials that show the tool in different applications, and how to use it and generate reports. To meet the goals of understanding and employing strategies for a project to support social equity, the EJSCREEN tool can be an invaluable overview “screening” tool to help guide further investigations, and to support communication to stakeholders about social and environmental disparities at the scale of a city, community or site.


 map environment that runs entirely online. The system covers the entire U.S. at […]&redirect_uri=http://insight.gbig.org/the-u-s-epa-ejscreen-a-resource-for-social-equity-design/)