
Code Green Solutions
There is ongoing curiosity as to whether LEED buildings perform in line with market expectations on energy efficiency measures, or similarly, if LEED buildings perform better on energy efficiency metrics than non-LEED rated counterparts. Until recently it has been difficult to analyze the performance of LEED buildings across a large and comparable set of buildings within a single geographic location. The emergence of local energy benchmark ordinances in many US cities requiring the disclosure of energy performance data has led to the emergence of robust data sets from which to analyze building performance.
USGBC recently analyzed the District of Columbia’s 2012 Private Building Benchmarking Disclosure data in an effort to better understand the energy performance characteristics of LEED certified commercial office buildings in the District of Columbia. This data set included 275 commercial office buildings benchmarked for energy use using the US EPA’s ENERGY STAR Portfolio Manager program. Of these 275 office buildings, 254 buildings reported valid site EUI and electricity usage results. Of these valid observations, 115 buildings are LEED certified (45%) and 139 are not LEED certified (55%).
Besides a focus on energy consumption, the District’s benchmark program also includes water consumption metrics. Of the benchmarked office buildings, 234 reported valid water usage data, these buildings were similarly distributed with 107 LEED certified buildings (46%) and 127 non-LEED certified buildings (54%).
This data set represents the most comprehensive look at actual LEED building performance to date within the District of Columbia
FINDINGS
The findings from DC’s 2012 Private Building Benchmarking Disclosure data are encouraging and reinforce the market value of LEED certification. LEED office buildings had a 13% lower average site EUI (64.0 kBtu/SF vs. 73.3 kBtu/SF), 11% lower average electricity usage (18.0 kWh/SF vs. 20.2 kWh/SF) and 16% lower average water usage (17.9 Gal/SF vs. 21.4 Gal/SF) when compared to non-LEED certified office buildings.
Using Pepco’s average commercial electricity rates [here] and the District of Columbia’s water rates [here], these efficiency differentials equate to a financial advantage of $0.22/SF for LEED certified office buildings. With an average size of 359,000 SF, LEED buildings hold a sizable financial advantage compared to market totaling over $80,000 per year in projected operating cost reductions. Assuming a very conservative 5.5% cap rate, this $80,000+ annual financial advantage equates to $1.5 million in increased asset value for LEED certified buildings (see CBRE 2Q14 cap rate survey).
The following chart includes box plots of site EUI results for LEED and non-LEED buildings. The chart on the left includes buildings certified under all LEED rating systems, and shows that LEED buildings are clustering around a lower average site EUI than non-LEED buildings. Although most LEED and non-LEED buildings are clustering around a respective average site EUI, there are some outliers that lag their peers.
The box plot on the right only includes the 24 office buildings certified to LEED building design and construction (BD+C) rating systems. When excluding the 91 buildings certified under the LEED EB:O&M rating system to focus solely on new construction, the results show that the 24 office buildings certified under a LEED BD&C rating system are outperforming non-LEED-rated office buildings.
While LEED BD+C certified projects achieve points based on modeled expectations, benchmark data clearly shows these buildings are outperforming non-LEED buildings. This above-market performance can be attributed to two fundamental LEED BD+C prerequisites – minimum energy performance and building commissioning. All newly-constructed LEED certified buildings must be designed to surpass minimum building code thresholds as defined by ASHRAE. In addition, all new LEED buildings must commission the mechanical, electrical, plumbing and renewable energy systems. The DC Benchmark data shows how, on average, investments in energy efficiency and building commissioning as seen through LEED certification result in market outperformance.
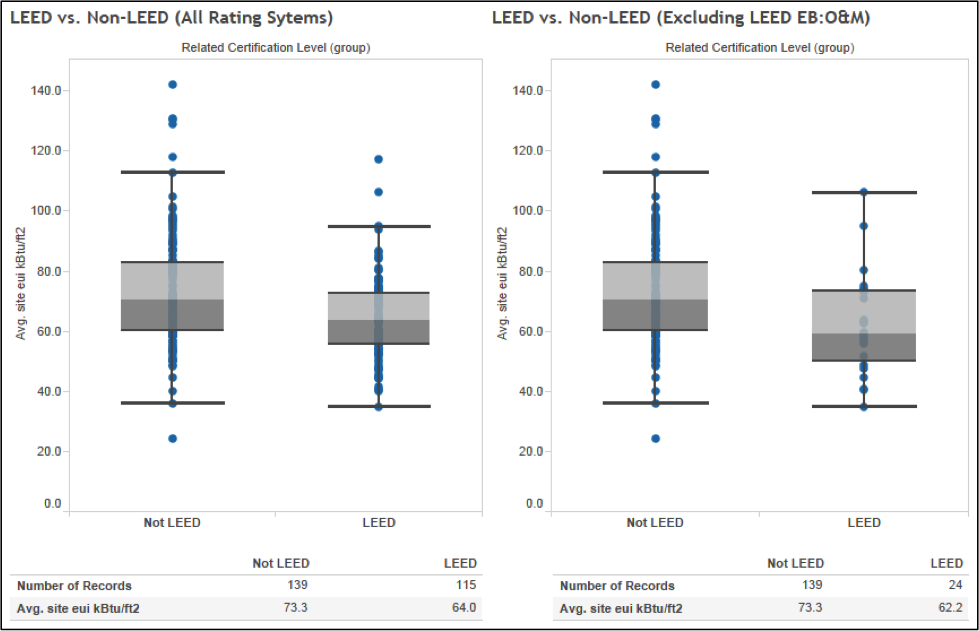
Fig.1 – Site EUI results for LEED and non-LEED buildings in Washington, DC.
What about Building Attributes Affecting Performance?
There are many attributes that can affect the performance of a particular building, and we cannot examine all of those factors within the scope of this analysis. But two common factors analyzed in relation to building performance are the age of the building and the size. The following chart shows that the performance gains seen by LEED buildings is maintained across age groups and building size groups.
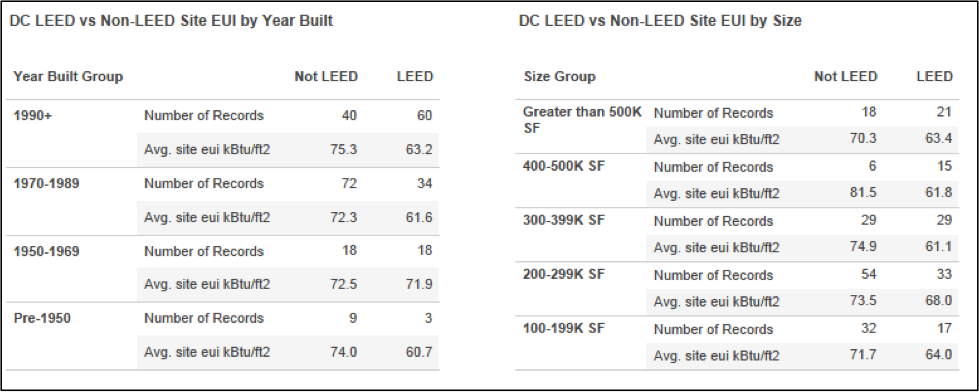
Fig.2 – EUI by year built and building size.
DIGGING DEEPER
The simple bifurcation of LEED vs. non-LEED buildings is interesting to many market participants, but this view can be parsed further.
It is the case that other high performing buildings may have yet to achieve LEED certification, or may have decided not to pursue a LEED rating at any level. With this in mind, we have further segmented the analysis into three subsets including 1) LEED certified, 2) not LEED certified, but ENERGY STAR label eligible (i.e. ENERGY STAR score >= 75), and 3) not LEED certified, and not ENERGY STAR eligible (i.e. ENERGY STAR score < 75).
Within this segmentation analysis, the performance gains of LEED and ENERGY STAR buildings compared to the remaining buildings is much more pronounced. The 2012 DC Benchmark data in the next chart below shows that LEED buildings demonstrate a 26% lower average site EUI (64.0 kBtu/SF vs. 86.8 kBtu/SF), 23% lower average electricity usage (18.0 kWh/SF vs. 23.4 kWh/SF) and 24% lower average water usage (17.4 Gal/SF vs. 20.7 Gal/SF) when compared to office buildings that are not LEED certified and not ENERGY STAR eligible. Using the average commercial electricity and water rates in DC, this equates to a savings of $0.55/SF or nearly $200,000 per year for the average LEED office building in DC — a value differential approaching $3.6 million.
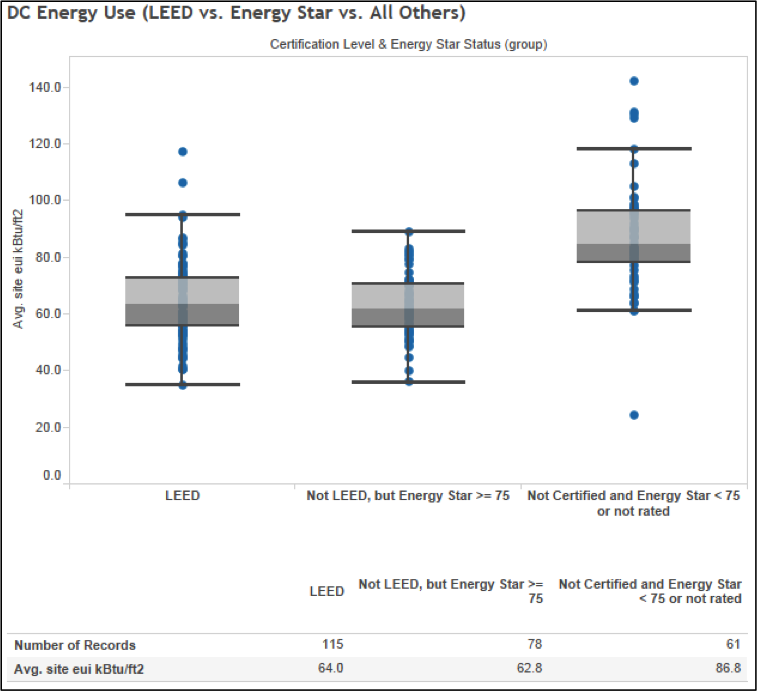
Fig.3 – Average Site EUI: LEED vs. Energy Star vs. All Others.
EAc1 ACHIEVEMENT AND SITE EUI CORRELATION
The following chart plots the percentage of EAc1 points awarded compared to the site EUI for all LEED buildings in the data set. This chart shows a general correlation such that projects achieving a higher percentage of EAc1 points report a lower average Site EUI. But, as you can see, there is a lot of variance around the trend line. This variance indicates that the industry should strive for more accurate models, or that building operators should continue fine-tuning building systems so that outcomes more closely match expectations. More likely, reducing this variance will require a combination of both.
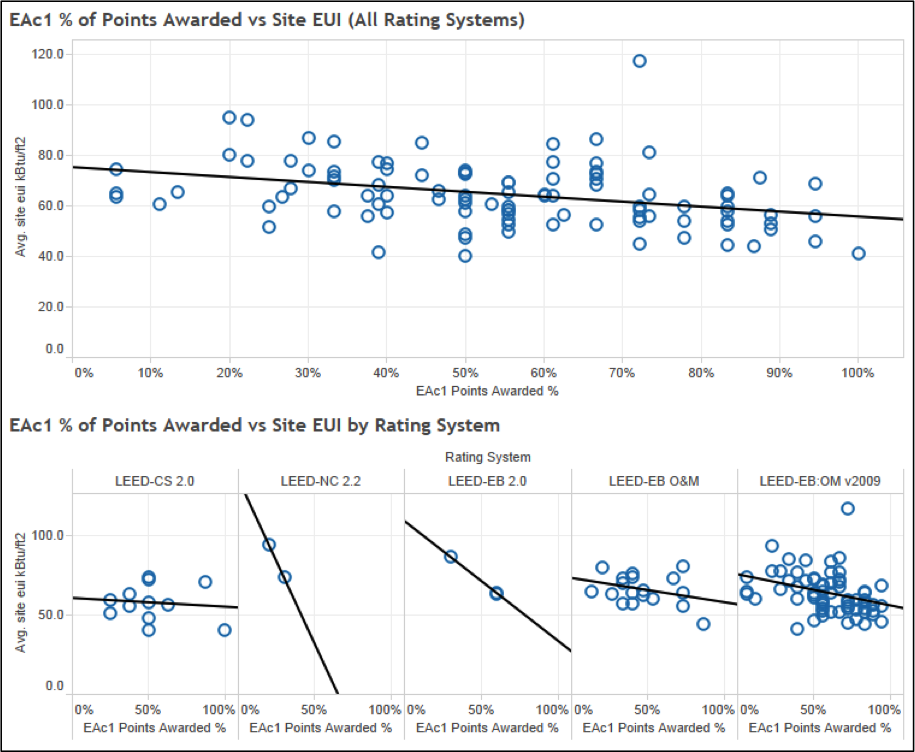
Fig.4 – LEED EAc1 points awarded vs Site EUI
CONCLUDING REMARKS
The results from the District of Columbia’s 2012 Private Building Benchmarking Disclosure data should allow industry participants and policy makers to draw three major conclusions:
As the number of cities implementing benchmark and disclosure programs grows (see BuildingRating.org), USGBC looks forward to the availability of more energy and water consumption data to better understand how LEED is driving and sustaining continued market transformation.
Notes on data and methodology:


