
Code Green Solutions


Every LEED for New Construction project achieves a minimum level of energy efficiency that significantly exceeds requirements of advanced energy codes, typically ASHRAE 90.1 and California Title 24. Almost every LEED-NC project does more with design features intended to far exceed these prerequisites.
This raises some questions: What is the range of LEED-NC energy efficiency design goals? How do they vary by space type and climate zone? What are the best projects doing? The reference charts and tables below provide some answers based on a unique sample of 1816 LEED-NC certified buildings across 8 ASHRAE climate zones and 10 common space types.
Let’s use an example to consider how to interpret this new data. Let’s say your project is a university building in Columbia County, NY targeting a 37% energy performance improvement according to ASHRAE 90.1 2007 baseline building. How does this energy efficiency design goal compare to others?
Looking at the charts, we can see that a 37% design goal is above average for all LEED-NC 2009 projects and just short of the Top 25%. We can narrow the comparison in two ways. First, we can segment by space type. The 37% design goal is even better with respect to only educational facilities. Compared to its educational peers, the proposed project would be far above average and easily in the Top 25%. Second, we can segment by climate zone. In this case, the results are more similar to LEED-NC overall. Again, the 37% goal is above average, but outside the Top 25%.
Chart 1 The highest, lowest, and average % reduction over baseline for LEED NC projects across 10 space types.
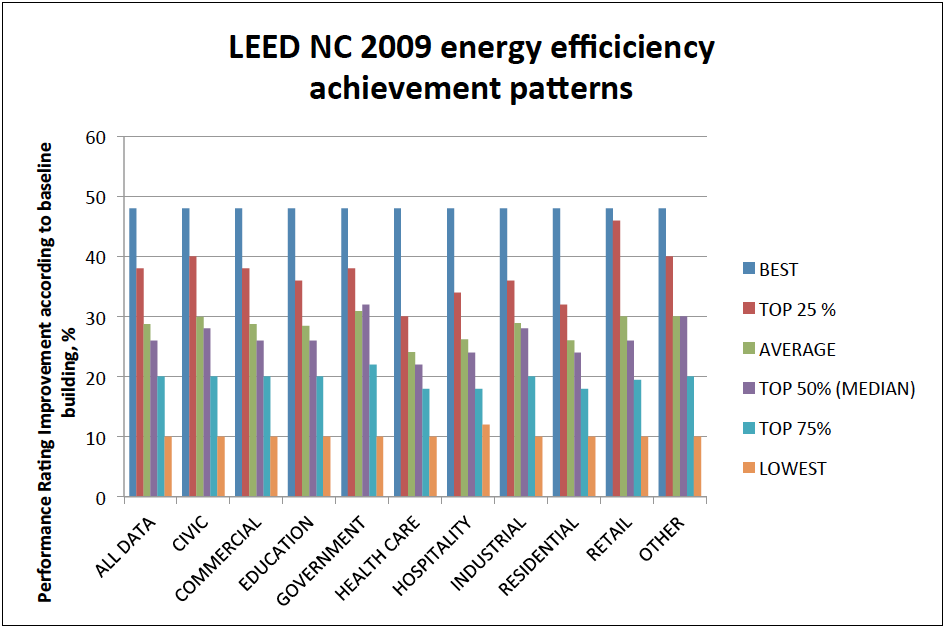
Chart 2 The highest, lowest, and average % reduction over baseline for LEED NC projects across 8 climate zones (Note: there is only 1 certified NC 2009 project in climate zone #8).
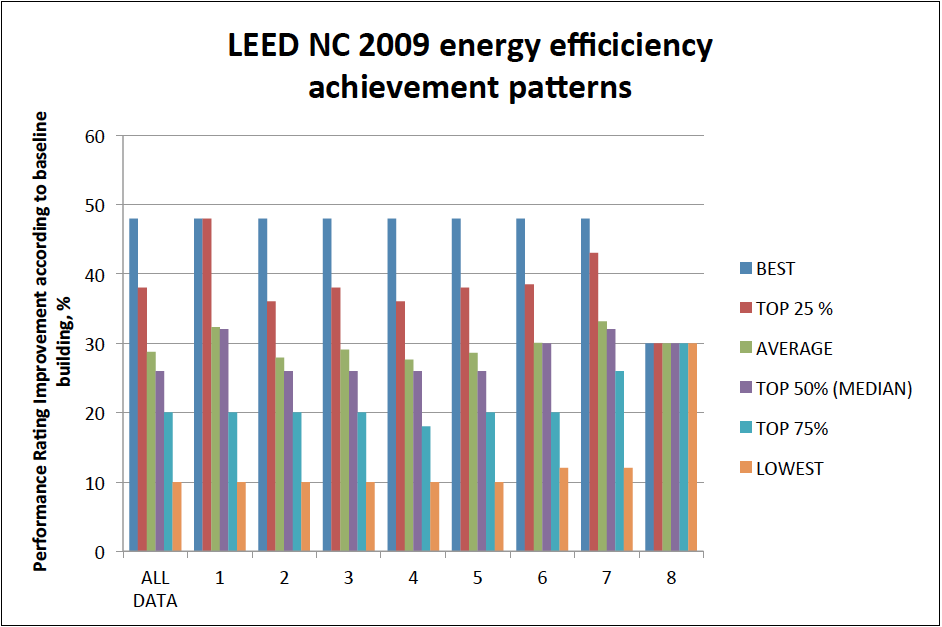
Table 1 The highest, lowest, and average % reduction over baseline for LEED NC projects across 10 space types.
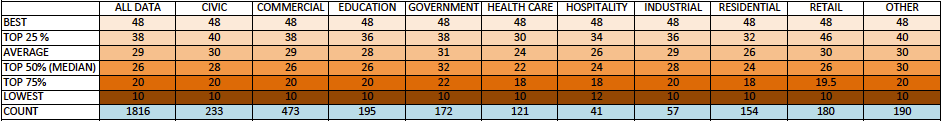
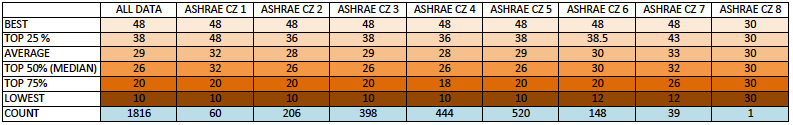
Table 2 The highest, lowest, and average % reduction over baseline for LEED NC projects across 8 climate zones.
Note: For each project, the % improvement over baseline performance rating was calculated by converting the number of points achieved on EAc1 to the minimum energy cost savings percentage for each point threshold. For this reason, on any given project, the actual modeled % improvement may be slightly higher than the numbers used in this analysis. For example, a project with a 50% modeled improvement over baseline performance rating would be credited with a 48% improvement in this analysis, since the scale used on EAc1 tops out at 48%. Likewise, the scale bottoms out at 10% as this is the minimum % improvement required to achieve LEED NC 2009 certification [See p.32 & p.35 of the LEED NC 2009 Rating System].


