
Code Green Solutions

Article co-authored by Claire Fitzgerald.
With the Paris Accord and 195 countries pledging to reduce greenhouse gas emissions by 80-90% by 2050, the world appears to have made a vital pivot towards a more sustainable future. But what does this mean in practice? What kind of personal commitments does this imply for each of us on the planet? How close are we to achieving the personal carbon goals that will deliver a future with temperature increases “well below two degrees”? And what leadership can students bring to this challenge?
#CleanEnergyU’s research intern Claire Fitzgerald, a University of Washington freshman, set out to help answer these questions, investigating the carbon emission profiles that would be typical for students across the country.
Many leaders recognize that by 2050, to achieve Paris’ promise, we will all need to produce no more than about 2 tons of CO2 per year. As Mark Kenber, CEO of the Climate Group, has framed it:
“100% renewable, decarbonisation, climate neutrality and a 2 ton personal carbon budget pledge by mid-century, linked with ambitious action in the short-term, are the only kinds of serious long-term targets which will give us a reasonable chance of keeping below 2 degrees and drive the innovation and investment necessary for us to get there.”
So, a carbon-neutral, 100% renewable planet by 2050?? If that’s what Paris means, are we going to get there?
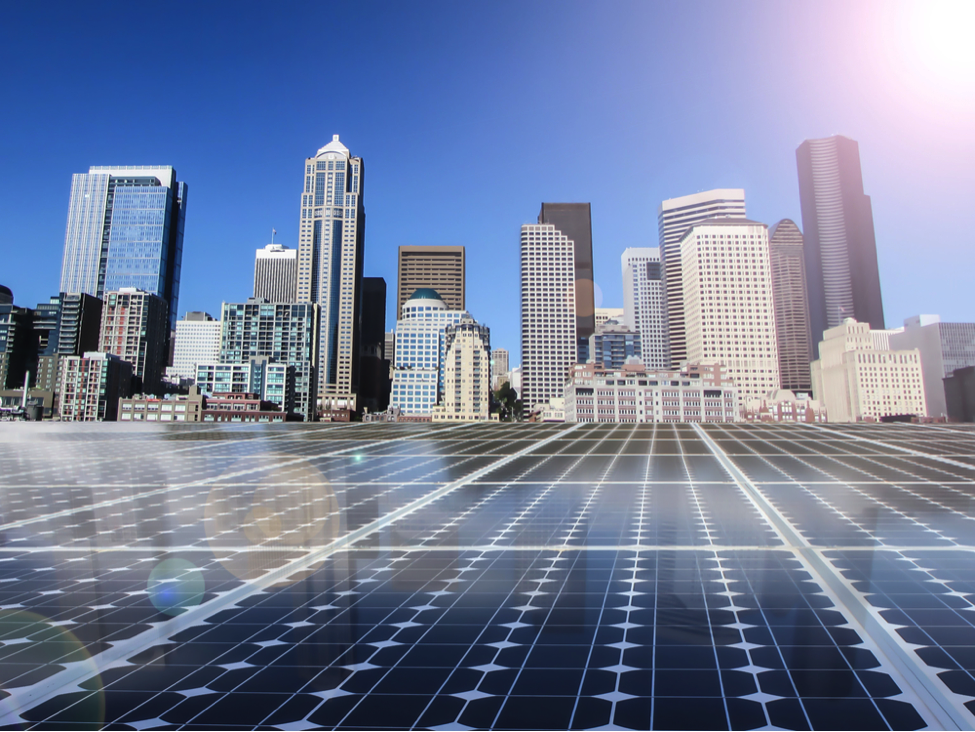
Fortunately, 700+ campuses have already set such carbon-neutral goals with ACUPCC; and many, such as Ball State University, with its campus-wide geothermal installation and the AU/GWU joint investment in 52MW of off site solar, are already scaling up their investments in large-scale renewables projects. Students from Sierra Club’s #seizethegrid campaign are urging more campuses to commit to 100% renewable energy – joining the likes of Google, Amazon and 56 other leading companies which have already made such pledges through the RE100 alliance. Cities, from Portland to New York, have pledged to go carbon neutral while Seattle City Light delivers carbon-neutral electricity to its customers and Interface markets Cool Carpet to help campuses take their supply chains carbon neutral.
So with all these 100% renewable and carbon-neutral commitments – championed across corporate civic and campus networks – how close are we to achieving the 2 tons personal CO2 footprint which we all need to deliver by 2050 to achieve this future well below a 2 degree temperature rise?
Let’s ask Claire: she’s been analyzing the CO2 emission profiles for all the university campuses who pledged with ACUPCC to go carbon neutral—and has been calculating the resulting student carbon footprints. So let’s see how close students are to achieving this 2 ton CO2 per person goal!
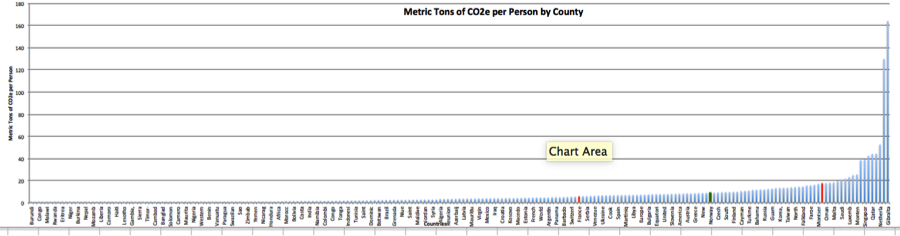
Claire, just to set the stage here before we focus on students per se, what are the average CO2 emissions for each person here in the US right now? And how does this compare to citizens in other countries?
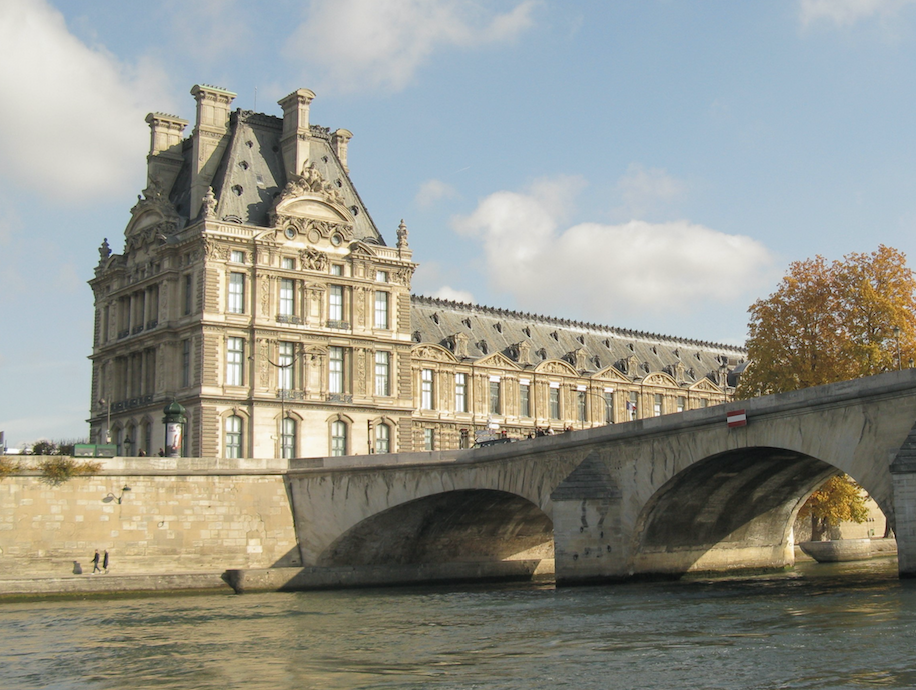
Claire Fitzgerald: The US ranks in the top 15 for the highest average CO2 emissions; we emit 18 metric tons CO2 per person from all our fossil fuel emissions. This is quite high compared to the top two most populous countries, China and India, which rank closer to 50th and 100th with CO2 emissions just shy of 6 and 2 metric tons. Furthermore, take a look at the contrast between the US’s 18 tons per person (which mainly relies on coal and natural gas) with other developed countries like Norway, whose average is 8.9 tons of CO2, (mainly relying on hydroelectric) and France, whose average is 5.7 tons of CO2, (mainly relying on nuclear fuels). So it’s clear that we could sustain a “first world” lifestyle while producing almost a half to a third of US per capita emissions!
What are the largest contributors to these emissions?
CF: The main contributor to CO2 emissions is the burning of fossil fuels for transportation, generating electricity and heat, and industry. So as individuals we therefore need to look at our footprint focusing both on our direct energy and transport emissions but also those CO2 emissions embedded in our food and the products and services we purchase.
![Doctoral Campuses’ Average GHG Emissions By Source [Source: Second Nature]](http://insight.gbig.org/wp-content/uploads/2016/04/Fig2_doctoral-campus-avg-emissions-by-source.png)
Doctoral Campuses’ Average GHG Emissions By Source [Source: Second Nature]
Let’s take our energy footprint to start with: what are students’ average energy-based CO2 emissions? Do these vary by campuses?
CF: The average energy-based emissions per student is 4 metric tons CO2– which would be equivalent to the average CO2 emissions per person in Mexico or Lithuania. The average CO2 emissions are lowest for associate schools (1.4 tCO2e ), followed by masters (3.1 tCO2e), doctoral (5.6 tCO2e), and finally baccalaureates (6.2 tCO2e) campuses. Individual schools’ per capita emissions can be found by clicking each school’s icon in the hyperlinked maps.
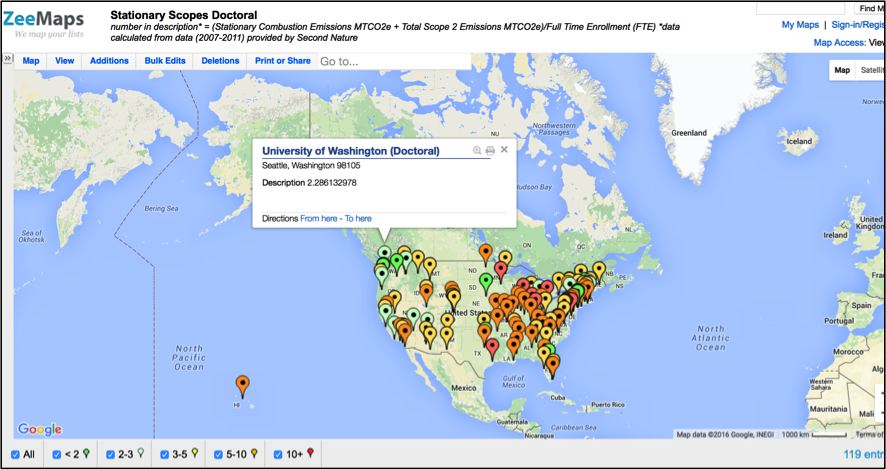
Ranges for Per Capita Energy-based CO2 Emissions for UW Doctoral Campuses
So that’s pretty striking; many campuses, especially masters and associate colleges, are already achieving close to or below 2 tons for students’ average footprint? Were you surprised?
CF: Yes. It was striking how low the students’ average of 4 tons of CO2 per capita was compared to the US average of 11 tons, which the University of Berkeley’s CoolClimate Calculator gives as our average per capita energy-based emissions. I would have expected students’ emissions to be higher since most campuses charge flat rate fees for students’ utilities usage which might discourage them from worrying about using too much water or heat.
![Berkeley CoolClimate Calculator: Average US Per Capita CO2 Profile [Source: Cool Climate Network]](http://insight.gbig.org/wp-content/uploads/2016/04/Fig4_berkeley-cool-climate.png)
Berkeley CoolClimate Calculator: Average US Per Capita CO2 Profile [Source: Cool Climate Network]
Why do you think some of the campuses are achieving such low figures with their students?
CF: One of the main reasons why associate schools have a low average CO2 emission is because the majority of students who go to these schools commute, so the emissions they produce at home and when commuting need to be taken into account to make fair side-by-side comparisons. Another factor that helps explain why college students have low CO2 emissions is that their style of living is different from at home. Most college dorms are closely packed together and have smaller square footage than students’ homes. ACUPCC campuses have also made strenuous efforts to reduce emissions, with 60% of all campuses achieving an average of 21% reductions.
So what happens when we add in students other consumption choices? What about transport for example?
CF: As expected, CO2 emissions go up when transport is added. At the beginning and end of three semesters, traveling by 500 miles via transit rail or plane, increases students’ CO2 emissions in the range from 0.6 (transit rail) to 1.34 (plane) tons CO2. (Check out your travel-based emissions in the graphs below).
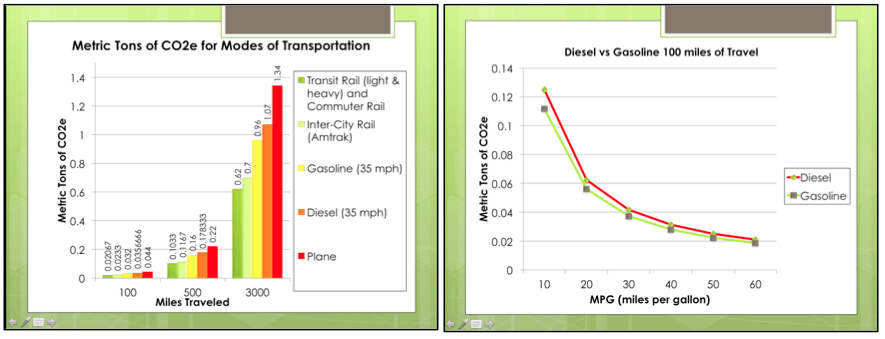
Commuting in and around campus during the semester can also add up to another estimated 0.98 tons CO2, on average at Doctoral colleges. So smart travel choices are essential if we’re to get to 2 tons CO2 per person.
OK, so we all need to eat. What can we learn about our choices here?
CF: After creating low-carbon (no meat) and high-carbon (meat) meals for a typical college student, with the help of Natalie Shea, a St. Olaf freshmen, the high-carbon meals totals about 1.7 metric tons per year while the low-carbon meal totals around 0.28 CO2 emissions in metric tons per person a year. It seems that if we want to reach 2 tons of CO2 emissions per a person, we’ll have to begin limiting the meat intake for our diet, especially beef. To find out more about your individual food scores, go to the Bon Appétit carbon calculator.
![[Source: Bon Appetit]](http://insight.gbig.org/wp-content/uploads/2016/04/Fig6_meals.png)
[Source: Bon Appetit]
So if I’m eating less meat, commute low carbon and take buses or trains to get back home I’m doing pretty well. What about all my other my purchasing? There are greenhouse gas impacts associated with the production of the products and service I buy (before I use them)… so what are the big ones to watch?
CF: So, Channel 4 in the UK did some research to ask how many computers, cell phones, diapers, carrots, cups of tea, refrigerators… how much stuff we purchase on average in a life time. Climate Neutral Business Network did some back-of-the-envelope calculations to work out which product categories had the largest greenhouse gas impacts. Products to watch include:
Interestingly these emissions are typically lower than our average consumption of meat products: take for example:
So some commentators (including NPR) suggest that avoiding beef products can avoid CO2 emissions comparable to driving one’s car!
The University of Berkeley’s Cool Climate Calculator also points out that services can incur around 6 tons of CO2 a year! So as we go virtual, students can also make smart choices in how they surf the internet: check out Google’s significantly lower CO2 impact for example due to their more efficient servers.
So Claire what did you learn from this research overall?
CF: Overall I learned that energy-based CO2 emissions contribute most to a college student’s footprint, while traveling and eating also play a significant part, especially when beef is part of a meal. Although as students we don’t have control over everything that contributes to our CO2 emissions, we can start taking action now, whether it is walking more or changing our diet.
When I calculated my personal CO2 footprint, I was shocked to find that my high school graduation trip to England doubled my impact to 8 tons CO2! Interestingly, without this long flight, my CO2 profile would have been closer to 4 tons CO2.
| Category | Metric Tons of CO2e |
| School | 2.3 |
| Plane (round-trip to Europe) | 4.4 |
| Transportation (Car, transit rail) | 1.0 |
| Food | 1.0 |
| Total | 8.7 |
So I was also encouraged to learn that UW had a relatively low campus carbon footprint: without my once in a lifetime UK flight, my core personal CO2 budget was therefore much lower than I expected — so check out yours too!
Perhaps the last word here might come from Gifford Pinchot. He recognizes that we can optimize our happiness while reducing the damage we incur on the planet if we actively manage our “happo-dammo” ratio. He simply advocates for making choices which make us most happy for the least impact: a simple metric to live by!
So the road to a 2-ton future might seems closer than we might think. Students are at a unique point in the journey of their lives: a junction where 2 tons CO2 is pretty close to a footprint they could achieve. With the shift to the sharing economy, radically different paradigms for the value by which we live our lives, it will be fascinating to see whether students choose to sustain this kind of footprint throughout the rest of their lives.


