
Code Green Solutions


If buildings are a major contributor to climate change, then what’s the solution? Reductions in energy use, water use, and transportation emissions, of course.
But, how do we know how far we have to go, how fast – and how will we know when we as an industry are part of the solution and not still the problem? Even more interesting, if you own an existing building, how do you know if you’re doing your part?
For almost a decade, The 2030 Challenge has provided an inspirational, measurable goal for properties to reach for – and measures for figuring out how we’re doing. In 2015, those goals stand at:
If you’re lost already, you can catchup quickly by reading the glossary of 2030 terminology, including The 2030 Challenge for Planning, 2030 Commitment, 2030 Palette, 2030 Product Challenge, and 2030 Districts.
If you’re already following along, you’re aware that there are lots of newly constructed buildings working towards these goals on the design side – 2,464 projects totaling 1.6 billion gross square feet (as reported by the 2013 AIA 2030 Commitment Report).
In terms of existing buildings, however, the applicable model worldwide is 2030 Districts, of which there are 10 in North America (listed by magnitude of commitments to 2030 reduction goals): Pittsburgh, Seattle, Cleveland, Toronto, Denver, Dallas, Los Angeles, Albuquerque, San Francisco, and Stamford. Totals commitments to 2030 Challenge goals across these 10 cities include over 229 million square feet of existing buildings. There are also 6 emerging 2030 Districts that have been formally organized, with a host of other cities exploring how to adopt the 2030 District concept on a local level.
At their most basic, 2030 Districts connect property, community, professional, and resource partners in defined geographic areas (mostly downtowns, but not exclusively) to inspire measurable change as they work collaboratively to get every new and existing building in the boundary to commit to the aggressive reduction goals of The 2030 Challenge.
2030 Measures
2030 District goals are those of The 2030 Challenge, but their achievement is measured performance against national and district baselines. Thus, as properties commit to and work towards their 2030 goals, the individual baselines against which they are measured become increasingly important. Consequently, the three primary baselines every 2030 District has are energy, water, and transportation emissions; how these baselines are set is integral to each District’s implementation – and ultimate success. Select 2030 District have also committed to developing additional criteria that reflects that 2030 Challenge model – and are possibly adoptable by 2030 Districts nationwide. The Pittsburgh 2030 District is piloting an indoor air quality target; the Seattle 2030 District has a stormwater calculator.
In order to measure a 2030 District’s success in reaching its 50% reduction goals, baselines for each reduction category must first be determined. Energy reduction goals are measured against a national baseline; water and transportation reductions against District-specific baselines.
National 2030 Challenge Energy Baseline
In 2007, Architecture 2030 with AIA, ASHRAE, IESNA, and USGBC (and support from U.S. Department of Energy) agreed that the national 2030 Challenge energy baseline would be national median whole building site energy use intensity (kBtu / ft2 / year) as determined by the 2003 Commercial Building Energy Consumption Survey (CBECS) data, which is a representative dataset of U.S. building energy costs, consumption, and energy-specific characteristics.
In the world of 2030 Districts, any building can use Energy Star Portfolio Manager to determine its individual energy baseline (site EUI), with baseline details becoming more complicated when buildings incorporate multiple use types (i.e., mixed use) or have a primary use category for which CBECS data is not a good approximation (e.g., convention centers, laboratories, museums, and stadiums).
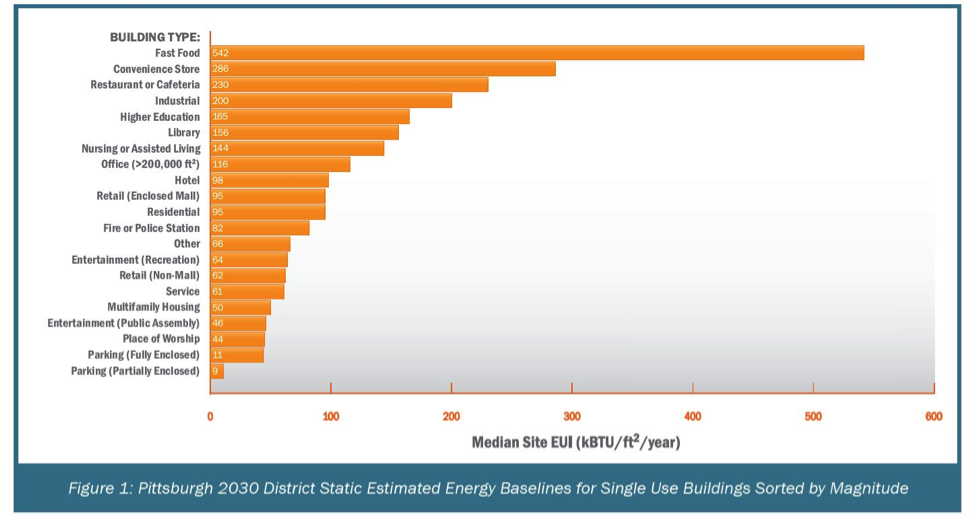
A light summary on determining the national energy baseline at both the building and District level is included in the Pittsburgh 2030 District Energy Baseline, with Figure 1 below providing high level estimates for Pittsburgh buildings use types whose site EUIs are static regardless of square footage (but vary based on occupancy and operational profiles). Primary use types not included below are summarized in the full report, as site EUI can be estimated based on whole building square footage.
A full description of the process required to develop the Pittsburgh 2030 District’s energy baseline was recently published in the Journal of Green Buildings. The Seattle 2030 District is the only other 2030 District to date that has published its energy baseline.
2030 District Water Baselines
Unlike the energy baseline, there is no national average for existing building water consumption. As a result, each 2030 District must collaborate locally to establish district-specific water baselines of water use intensity (WUI) in gallons per square foot per year (gallons/ft2/year) for different building types. To take into account seasonal and annual variation, best practice is to consider historic water consumption over multiple years.
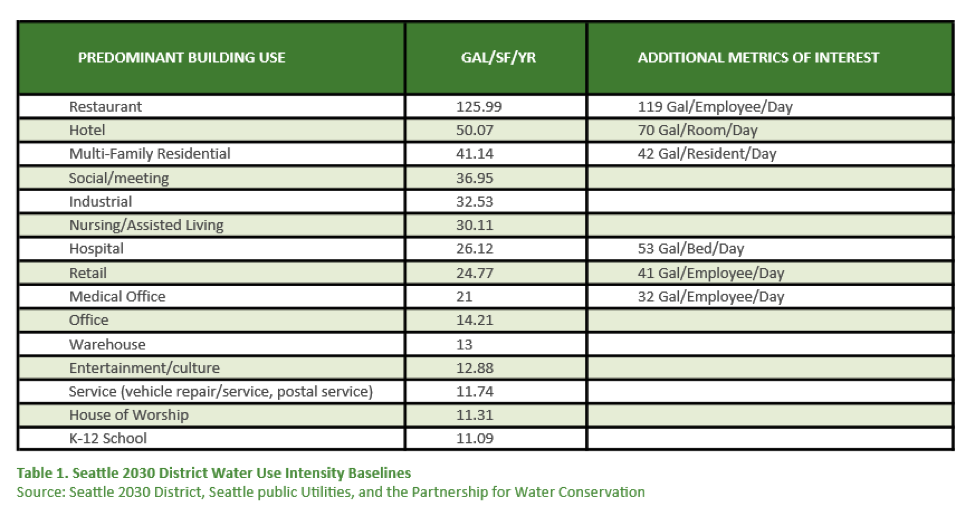
Only two 2030 Districts have completed their water baselines. In 2012, the Seattle 2030 District was the first to publish its water baseline with the help of the Partnership for Water Conservation; the baseline averaged and normalized whole building water consumption from 2002 through 2010. In the Seattle 2030 District’s water baseline, WUI ranges from 11 to 126 gallons / ft2 / year across 15 building use types.
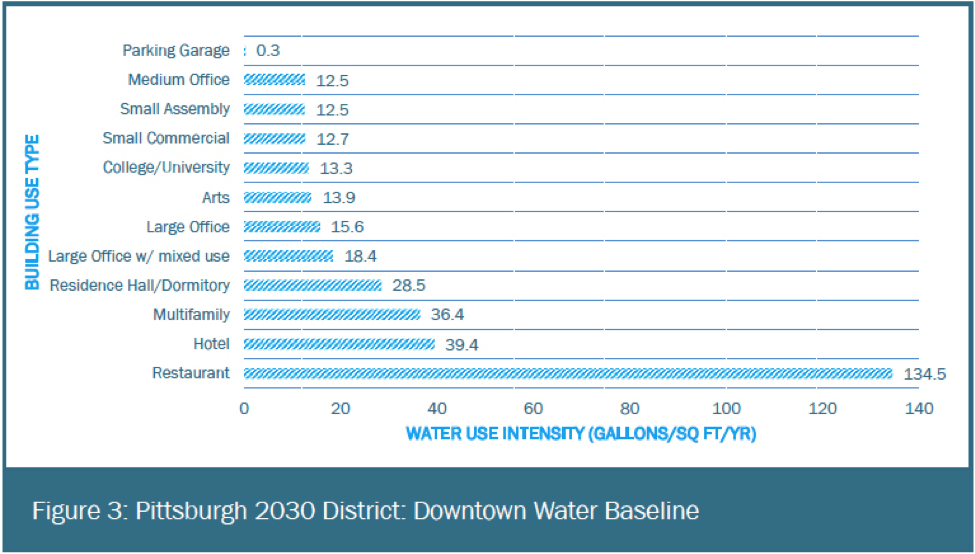
The Pittsburgh 2030 District is only the second district to traverse this same road, publishing the
Pittsburgh 2030 District: Downtown Water Baseline in 2015, which included historical consumption from 2009 through 2012 — developed in collaboration with the Pittsburgh Water and Sewer Authority. In the Pittsburgh 2030 District’s water baseline, WUI ranges from 0.3 to 134.5 gallons / ft2 / year across 12 building use types. The Pittsburgh 2030 District expects to update its baseline in the future to reflect additional information from its second boundary in the Oakland neighborhood of Pittsburgh.
Though very different climate zones, comparison of WUI baselines between Seattle and Pittsburgh start to demonstrate how data availability, consumption history, and data quality play a key role in developing baselines of this sort.
2030 District Transportation Baselines
Similar to the water baseline, each 2030 District must collaborate locally to establish district-specific transportation baselines. Different from The 2030 Challenge’s energy and water reduction goals (which are based on consumption reductions of 50% below baseline), The 2030 Challenge transportation measure is focused on 50% reductions in transportation CO2 emissions. As such, each 2030 District transportation baseline must establish an average mode split and associated carbon dioxide emissions from commuter transportation to and from the 2030 District’s boundary.
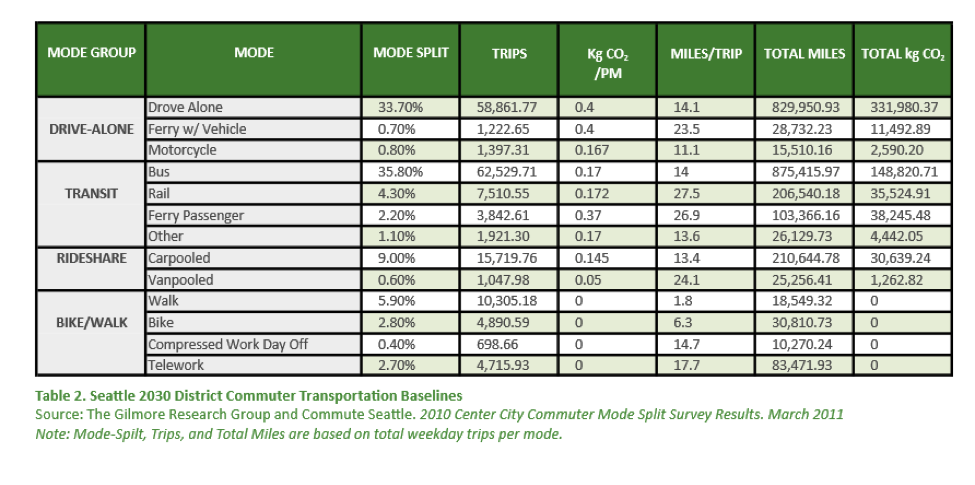
To date, the Seattle 2030 District is the only district to have completed its transportation baseline, collaborating with Commute Seattle to use 2010 “Center City Commuter Mode Split Survey” data to create it. Seattle’s baseline estimations are that average annual CO2 emissions per commuter are ~900 kg, with 33.7% of commuters driving alone, 35.8% riding the bus, 9% carpooling, 5.9% walking, 2.8% biking, and 2.7% teleworking.
The Pittsburgh 2030 District’s baseline for Downtown will be completed later in 2015, being developed in collaboration with the Southwestern Pennsylvania Commission, which is the Metropolitan Planning Organization (MPO) for the 10-county region of Southwestern Pennsylvania that includes Pittsburgh.
Both Pittsburgh and Seattle’s transportation baselines will be limited to commuters. In future years, 2030 District transportation baselines could consider deliveries, visitors, and attendees at entertainment, sports, and assembly venues.
Of even greater interest to the 2030 District network is how a 2030 District goes on to measure against its transportation emissions baseline (once that baseline is set). Seattle has led the way with a biannual commuter transportation survey whose results primarily inform regional transportation planning (but also serve 2030 goals); Pittsburgh will follow this lead in Fall 2015, with a comprehensive, multi-neighborhood, mixed mode commuter survey. The benefit of a commuter survey as an ongoing performance measurement of progress towards 2030 District goals is clearly demonstrated by Seattle’s survey results, which show a 2014 increase of ~26,000 commuters over their baseline year, with a parallel increase in the percentage of those commuters on transit (3% more), walking (1% more), and biking (0.3% more).
Are Goals Being Achieved?
It’s one thing to commit to the goals of The 2030 Challenge Goals – and quite another to achieve them. With 229 million square feet currently committed through 2030 Districts nationwide, the potential impact of the 2030 District model on building, district, city, and global scale efficiency is huge.
As the end of 2015 approaches, so does the first incremental 2030 Challenge goal of 10% reduction. How will the 2030 Districts Measure up? Pittsburgh and Seattle are already leading the way toward district-wide reporting of performance. More about these measured achievements next time around.
Interested enough to think about creating a 2030 District in your own city? Please, join us! You can learn more through the District Formation Toolkit, contacting any existing 2030 District, or by contacting Architecture 2030 directly.


